Adds a dynamic list of entries to each record. Log work hours, attendance records, list your collection, places you've been...adds a whole new dimension to your Participants Database record.
Product Setup
- Setting Up the Log
- Configuring Log Entry Fields
- The Admin Record Log Display
- Adding Entries
- Exporting/Importing Entries
- The Frontend Log Entry Display
- Showing a Log Summary
- Showing an Interactive Log
- Showing a Global List of Log Entries
Global Log Configuration
In the Participants Database admin menu will be an item named “Participant Log.” On that page you will find the global settings for all logs under the “General Settings” tab. This is where you set things like the template (which controls the layout) and other general settings for all the logs. These settings can be individually overridden in the log field definition if needed.
Creating the Log
This plugin allows you to create one or more logs where a list of items can be stored an interacted with. You start by creating your log:
The first thing to do to set up a new log is to use the form at the top of the General Settings tab (pictured above) in the plugin settings to add a new “Participant Log” field to the Participants Database on the Manage Database Fields page. This new field is the “container” for the log, and in most ways is simply another field in the database. The General Settings tab of the plugin settings menu provides a way to add a new log. When this field is created, a new table is added to your WordPress database which will hold the data for the log.
It is important that the name of your log should be the name of what is stored in it. If, for example, the log is meant to record a person’s time spent volunteering, you might call it “Volunteer Hours.” If it is storing a record of class attendance, you could call it “Class Attendance” or “Attendance Record.” You can change the title that is displayed once it is set up, but the name of the log field can’t be changed, so it’s worth taking a minute to think about what you call it before committing the name. Once you set up the log field, you can configure what is recorded in each entry of the log you created.
Configuring the Log
On the Participant Log admin page, you will see a tab for the log you created. Under that tab you can configure the log: you can set the name for an entry or entries which will help the user interface make more sense. There are more settings that determine what the frontend user can do and also how the log will be displayed in various contexts. This will be explained in more detail later.
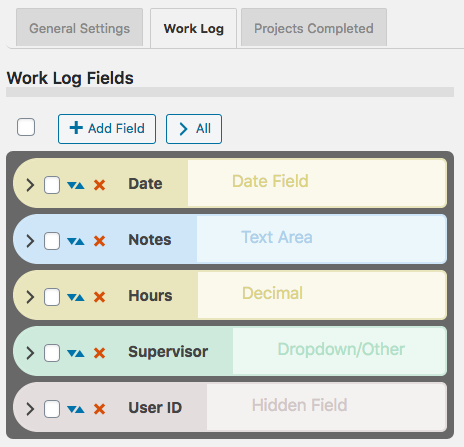
Configuring Log Entry Fields
Each log can have as many fields as needed to hold whatever information you need to store in each entry. The user interface for that is the same used for managing the fields in the main database. You can add fields, and then configure each field as needed. They work the same as fields in the main database. Each entry field you create for the log adds a column to the log’s database table.
Field Visibility
Entry fields have a “Visibility” setting that determines the context in which the entry field will be shown. “Public” means the field will be shown in all contexts. “Private” means the field will only be shown to the owner of the record and administrators. “Admin” means the field will be visible to administrators only.
Searchable Fields
When list searching is enabled, only fields that are both visible and marked as searchable will be used to get search results. This is helpful to making searches more efficient and avoids spurious results.
Searchable log entry fields are also available in regular Participants Database list displays so that records with log entries that match the search can be found.
Sortable Fields
Fields that have this setting enabled will be shown in the header of log entry list displays so the log can be sorted by the value of that field.
Field Validation
Entry fields can be made required in the entry field’s configuration. The entry fields use “client side validation” which means the user’s browser will perform the validation and provide the feedback. This is going to look slightly different on every platform, there is little you can do about that, but it has the upside of working on all platforms and devices. To make a field required, you set the validation setting to “required.” You can add to the field validation configuration by using validation attributes.
The Admin Record Log Display
The log display on the record edit page in the admin shows a list of all the entries. The list is paginated, and the number of entries shown on each page of entries is determined in the general settings for the log, in the “Entries Per Page” setting.
The display for the log on the frontend is similar, but what controls are shown depends on the configuration.
Entry List Filtering or Searching
There is a search input at the top, any text typed into the search input will be used to filter the list of entries. On the admin side, all the visible entry fields are included in the search. On the frontend, only fields marked as “searchable” will be included in the search.
Entry List Sorting
The entries can be sorted by clicking on the blue arrow icons seen in the top bar. The fields that can be used for sorting are configured in the log entry fields configurations: check the “Sortable” checkbox to configure the field to appear in the sorting bar.
Adding Entries
Once you have the entry fields set up, you can begin adding entries to the log. Entries can be added in the admin by going to the admin edit record page for the record you want to add log entries to. Find your log field on the edit record page and in the display for the log field, you will see a button with a plus sign for adding a new entry. Clicking that will bring up a form for entering the data for your log entry. Each entry may also be edited by clicking the pencil icon next to the entry. Clicking the pencil will open a form where the contents of the entry can be changed. Entries can be deleted individually by clicking the red on the entry line. When the “X” is clicked, you will be asked to confirm deleting the entry. There is no undo, deleted entries are gone forever unless you restore it from a backup.
Exporting/Importing Entries
In the admin record edit display (Edit Participant), the entry data for the record’s log can be exported as a CSV file. This works pretty much the same as exporting records from Participants Database: if you have used a filter, the export will only include the entries shown after the filter is applied. Records can also be imported with a CSV file. It’s also possible to import and export data for all records on the Participant Log admin page under the tab for the log.
The Frontend Log Entry Display
In single record and editable record displays on the frontend, the log is displayed as a list of entries. It is very similar to the display in the admin, only the ways that the user can interact with the list are controlled by settings. This is so you can choose whether the log can be added to by users, entries edited, deleted, etc. When the record is displayed using the [pdb_single] shortcode, a list of entries is shown using the template style chosen in the Participant Log settings under the general tab. The entry list in this display can be sorted and filtered. Only log entry fields that have “public” visibility will be shown in this display.
Display Templates
For the frontend displays of the log entry list, 3 basic templates can be chosen. Which one you choose is going to be determined by what you need to show, and what is going to work best for your users.
The Table template will put the log entries into a fixed-width grid so all the values will line up below a header row. This can be the clearest way to show the log entries, but you can only control the width of the table by controlling how many log entry fields you’re showing. Also, it isn’t great on small screens because the width is not determined by the device’s screen width, and so horizontal scrolling is usually required to see all the information.
The Responsive template takes the approach that every log entry field is a separate element with its own width determined by the title and data display. These elements can flow into whatever configuration will fit on the screen. With this template, all the data will be visible on any device, but it can be cluttered.
The Grid template is kindof a bend between the two. It is responsive in that the width of the log display is determined by the width of the device display, but instead of each entry field having its own width, the widths of the entry fields are controlled into columns. This can result in a more organized and easier to see display of the log entry data.
For any kind of responsive display, some adjustments of the CSS that controls the layout are often needed. These additional CSS rules can be placed in the Participants Database Custom CSS setting.
The Summary Display
Each log entry list display may optionally show a “summary” which is configurable to show an important value, such as the number of entries. By choosing a different sum type, the summary can also display other values. If the sum type is a numeric field, the summary will be a sum of the entry values for that field, such as for a work log that shows the number of hours worked. If the field is not a numeric field, the summary will show the number of records that contain a value for that field or if the field has a default value, the sum will show all the fields that have a value different from the default value.
When searches are performed on the list or when a date range is selected, the sum value is immediately updated to show the correct value. This also happens when entries are added, deleted or edited.
This sum value is also saved in the main database so that in Participants Database list displays, the list can be sorted by the summary value: for example you could rank volunteers according to the number of hours logged, or place the collector’s club member with the largest collection at the top.
Using a Non-Numeric Summary Field
The summary type field is typically used to display some kind of numeric sum from a record’s log entries, but it is also possible to use non-numeric or textual fields here. The way that works (as mentioned before) is the basic sum will be the number of entries with a non-empty value in the summary field. If the summary field has a default value setting, it will count all the entries where the summary field value is not the default value.. The total number of entries is always available in the summary template as [count].
But you can get a more detailed sum from textual summary fields: Participant Log version 1.10 introduces Value Count Tags for the summary template. A value count tag will show the number of entries where the summary field has a specific value. For example when you have a selector type field as your summary field, you can show the number of entries that have a specific value selected, like this [value:Registered] will show the number of entries that have the value “Registered” for the summary field. You can use several of these in the summary template to show a lot of detail about the record’s entries.
Using Value Count Tag Operators
With the use of an operator, you can also count the number of entries that do not equal a specific value, like [value:!=Registered] counts the number of entries that have some value other than “Registered.”
Operators can also be used to condition the number it will show when the summary field is numeric. The comparison is applied to the value of the summary field, so a value count tag like [value:>6] would show the number of entries where the summary type field value is greater than 6.
The operators you can use are “!”, “!=”, “<“, “<=”, “>”, “>=” The greater than/less than operators will only work for numeric values, the equal/not equal operators will work on all types of fields. If there is no operator, it is assumed to be “=”.
Using the Participant Log Field
Each log that you create has a corresponding Participant Log field. This field is used to display the log so it can be interacted with. You can control the visibility of the log by controlling the visibility of this field. Field visibility is normally controlled by the visibility setting of the Field Group the log field is in.
The log field also provides a convenient way to filter records based on what is going on in the log. The Log Summary settings will determine what value is stored in the log field. A simple example is by default the sum is the total number of entries. This means that you can filter by the total number of entries, for example to only show records that have log entries. The summary can be configured to count other things too, and that is what will be stored in the log field, so for example if you have your summary set up to count the number of “completed” log entries, you can easily use that to show a list of records that have completed entries.
Showing an Interactive Log Entry List
When the editable record is displayed using the [pdb_record] shortcode, the log entry display is sortable and filterable, but it is also possible to enable adding new entries, editing and deleting entries, and also import and/or export entries using a CSV file. The settings that control access to these features are in the Participant Log settings, under the General Settings tab. The user interactions in this display are very similar to what is possible in the admin. Log entry fields that have a visibility setting of “public” or “private” will be seen in this display.
Frontend Imports and Exports
The interactive log list display can also be configured to allow the user to import and/or export data to a record’s log. This is enabled under the global settings for the [pdb_record] log display.
Global Log Displays
It’s possible to display a list of log entries that are taken from all the log entries in all records. There is a special shortcode [pdb_log_list] that will show all the entries in the same way that the Participants Database list shortcode shows a list of Participants Database records. You can use shortcode filters, custom templates, search, sort, etc. to customize the display.
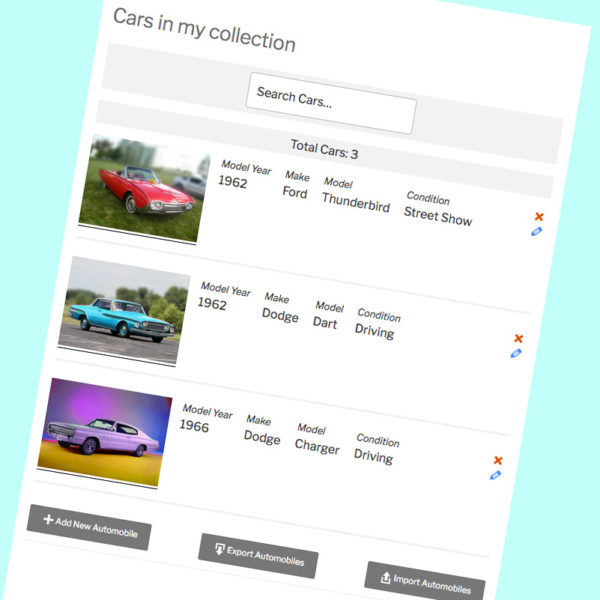
An example of the use of this shortcode would be a car club, where each member keeps a list of the cars in their collection. The global log display could be used to show all the cars in the club.
If you’ve got more than one Participant Log defined, you can tell the shortcode which one to use with the log_name attribute. Just give that attribute the name of your log, and it will show entries from that log. For example:
[pdb_log_list log_name=cars]
Log List shortcodes can be filtered just like the Participants Database List shortcode, you can filter by fields in the main database and by fields in the log. Check out the linked article for details.
Product Settings
General Settings
These settings will affect all logs, but it is possible to override them for a specific log in the participant log field definition attributes setting.
Enable Log Search: when checked, a search input will be shown above the display of log entries. This search input will search on visible fields only.
Enable Log Sorting: when checked, fields that are configured as “sortable” will show as sorting links in the header of the log entry list.
Enable Date Created Sorting: the “Date Created” field is an automatically set timestamp for every entry. This switch allows the user to sort the entries by this timestamp field.
Entries Per Page: sets the default number of entries to show in the list. If there are more entries in the log than this number, a pagination control will be shown.
Record Shortcode Settings
These are settings that pertain to showing the log list when using the [pdb_record] shortcode. The log list in this context is editable.
Record Shortcode Log Template: select the display template to use when showing the log entry list.
Enable Creating New Entries: when checked, allow the user to add entries.
Enable Editing Entries: allows the user to edit entries.
Enable Deleting Entries: allows the user to delete entries.
Allow Log Export: allows the user to export a CSV with the log entry data.
Allow Log Import: allows the user to import log entries in a CSV file.
“Slide In” Entry Controls: when checked, the log edit controls will be hidden until the user hovers over an entry. This is good for compact displays.
Highlight Color: lets you select the color to use when highlighting an entry while it is added or edited.
Single Shortcode Settings
These setting are used when showing the list of log entries when using the [pdb_single] shortcode.
Single Shortcode Log Template: selects the display template to use when showing the log entry list.
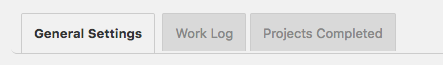
Individual Log Settings
For each log you have defined, there is a tab and under that tab are settings that are specific to that log.
Log Fields
In this section, the fields that are used for each entry of a log are defined. The interface is very similar to the one used on the Manage Database Fields page. There are a few differences, for example, there are no field groups (instead there is a “visibility” selector). And, like the Manage Database Fields interface, which options you can set depend on the type of field you have created. You can edit, delete and add log entry fields in this interface.
It is highly recommended that you define all the fields you need to use before adding entries to the log.

Log Options
For each log, a set of options is available:
Log Entry Name: name for a single entry.
Log Entry Name Plural: name for several entries.
No Entries Message: message to show when a log has no entries.
Search Field Placeholder: when the search input is shown, this placeholder string will serve as a prompt for the user.
Entry Image Height: the nominal image height for images uploaded to a log entry. The aspect ratio will be preserved in most cases.
Entry Dates
These settings are for configuring how entries are dated.
Primary Date Field: this allows you to select a log entry field to use as the date for the entry. It defaults to the timestamp that is set when the entry is created. You would use this in the case of something like a list of events where the date of the event is more important than the date the entry was created. This date field will be used to sort the entries chronologically.
Show Log Entry Timestamp: every entry has a timestamp, this preference lets you make that timestamp visible.
Timestamp Title: if you are showing the timestamp, this is how it will be labeled.
Date Range Filter
It is possible to filter entries by date range, these settings configure the date range interface.
Enable the Date Range Filter: check this to turn on the date range control for the log.
Date Range Filter Heading Text: title for the date range control. Leave blank for no title.
Date Range Filter Button Text: text for the button that performs the date range filtering.
Entry Sum Display
The “entry sum” is a feature of the log where a configurable sum is shown. The default is to show the number of entries, but if there is a numeric field in the log entries, the entry sum can show a sum of those values. For example, in a work log, it can show the number of hours worked.
Show Entry Sum in Record Displays: this is to enable a summary display just above the list of entries.
Sum Type: this is where you would configure what is summed.
Sum Display Template: this gives you a way to control how the sum is displayed. There are a number of “value tags” you can use to show dynamic values from the log in the summary display.
F.A.Q.
Is it possible to override the global setting in individual logs?
Yes, this happens in the log field definition on the Manage Database Fields page in the main plugin. You add your override to the “attributes” for example to override the global setting and allow adding entries on the frontend:
allow_frontend_add::true
Here is a list of the global settings with the proper name to use in the attribute:
| Setting | attribute name |
|---|---|
| Enable Log Search | enable_log_search |
| Enable Log Sorting | enable_log_sorting |
| Entries Per Page | entry_list_limit |
| Record Shortcode Log Template | record_module_log_template |
| Enable Creating New Entries | allow_frontend_add |
| Enable Editing Entries | allow_frontend_edit |
| Enable Deleting Entries | allow_frontend_delete |
| Allow Log Export | allow_export |
| Allow Log Import | allow_import |
| “Slide In” Entry Controls | hide_entry_controls |
| Highlight Color | highlight_color |
| Single Shortcode Log Template | single_module_log_template |
How can I show a customized sum of values for the log list?
Each log has a “summary display” that can be used to show a simple sum from the log data. If you want to show a sum that is specific to your application, such as a sum that is conditional, or a sum that involves multiple entry fields, you need some custom code for that.
In technical terms, the code you need is a filter handler that takes the normal value that would be displayed and changes it ro a custom calculated value. This is best added as a custom plugin or you can put it into your theme functions.php file.
The filter hook is pdblog-{$logname}_sum where {$logname} is the slug name of the log field. You’ll see that on the manage database fields page where the log field is defined.
The filter gets two arguments: the configured sum value (in other words, what the sum would show if you didn’t change it) and the second argument is an array of the record’s log values. You can calculate your sum from the values in that array, and then the filter handler should return your new sum, which will be displayed with the log as configured in the log’s settings for the summary display.
There is a simple example here: https://gist.github.com/xnau/fb961393fc675cf802a509a2a1c888d1
Is it possible to provide a link to the editable record in the Global Log List?
The Global Log List shortcode will show a filtered list of entries from all records for a particular log. Each line in the list is an individual entry from a record’s log. It is possible to place a link to the editable record in this list so that the log entry can be edited. This requires the use of a custom template.
Be sure to control access to this list display, you will be giving edit access to your records when you use it.
To use this custom template, you must first create a “placeholder” field in the main Participants Database plugin. You can also re-use an existing placeholder field if you want. Below is a link to the custom template. You must modify it to use the placeholder field you set up.
Is it possible to delete log entries that are no longer connected to a PDB record?
As of version 1.5.9, when a Participants Database record is deleted, the entries belonging to that record are deleted also.
If records were deleted prior to that version, or if records were deleted not using the “with selected” delete method on the List Participants admin page, you can end up with entries that no longer have a parent record.
There is a utility function you can use to clear these out. To do that go to the Participant Log admin page. Add &pdblog-delete-orphan-entries=log_name to the URL and hit return. This will clear out all the entries that are not connected to a PDB record. For example, if your log is named “automobiles” you can clear out the orphan entries from that log with a URL like this:

When creating a field for a new log, I get this error message: “Failed to create table for this log. You need to use a different name for your log.”
The message you’re seeing means that the table needed to create the log could not be created for some reason. The part about trying a different name is just the most likely reason for the failure.
What I suggest you do is start over: on the Manage Database Fields page, delete the log field. It will be a field of type “Participant Log” Once the log field has been deleted, go to the Participant Database settings under the Advanced tab and turn plugin debugging on to “all errors”. Once that’s enabled, open the Debugging Log page and clear the log.
Now, recreate the log: go back to the Participant Log settings page and create a new log. Try using a very simple name for the log at first…you can always change the display name of the log later, but when you’re first creating it it’s a good idea to use something simple. Once you’ve created the new log field, go back to the Participant Log settings and under the tab for the new log, create your first field for the log. If you get the error message again, check the debugging log.
If you can’t create the log field because of the error, post a question to tech support on this page.
Be sure to turn plugin debugging off again once you get things set up and working.
I have had several global log lists (frontend) with various filters for some time now, but they are now showing the wrong log for each record. Each patient has a record, and some have a debtor log. The global lists are still showing all the logs (filtered correctly by the look of it), but they are showing the wrong patients.
The admin side shows that the correct logs are associated with the correct patients, and the record page shows the correct log, it’s the global lists that are wrong.
I think this may have happened since the last update.
Debugging log:
“PDb_List::_setup_iteration list query: SELECT p.id, pdb.id AS pdbid, p.date_recorded, p.debt_added_by, pdb.patient_name, pdb.last_name, p.debt_action_taken, p.debt_initials, p.debt_type_of_action, p.debt_deadline FROM wpxf_participants_database_debt p JOIN wpxf_participants_database pdb ON pdb.id = p.record_id WHERE (p.debt_action_completed IS NULL OR p.debt_action_completed = “”) ORDER BY p.debt_deadline ASC, pdb.last_name ASC”
Thanks
Let me take a look at that and see what the problem is.
Hi Roland!
Thanks for a lovely collection of plugins. They’re making my life pretty easy!
I ran into a bit of Javascript problem with the Log popup dialogs. My Divi environment seems to be causing some confusion in calculating the offsets. The
always returns a “zero” offset. I replaced all the position() calls in participant_log.js with:
        var bodyRect = document.body.getBoundingClientRect(),

           elemRect = el.closest('.pdb-record')[0].getBoundingClientRect(),

           offset = { top: elemRect.top - bodyRect.top, left: elemRect.left - bodyRect.left };
That seems to have the popups showing up in the expected place instead of at the bottom of the page.
That’s a good solution, however it may be easier to make sure that the positioning of the ‘.pdb-record’ element is “relative” with an overriding CSS rule. My guess is that the theme is setting it to “static” or “inherit” because there is no positioning info for the element.
Hi Roland,
is there any way we can use the field shortcode from the Participants log in the email addon to retrieve certain field info just like the main participant’s database for notification in the email templates?
Thanks in advance
Serge
Can you be specific about what it is you want to show in the email template?
Yes, say I want certain field info from the log to show the info in that field within the email with example [general_audit_book_course_code] where general_audit_book is from the participants log within the participant’s database any field I create in the main participant’s database like [first_name] as normal shows up fine in the email but any field I choose from the log doesn’t come out in the email
hope that is clear
Yes, well the problem is that there are usually several entries in the log, and so the template is not going to know which value to show. You can show a “custom sum” from the log, but that is not the same as showing a specific value from a specific log entry. To do that, you will need some custom code.
Hi Roland,
I have a small issue with add_entry or update_entry. It trims the spaces of the link field probably because of sanitization, is there a way to avoid this?
$data_user = array(

            "properties_interactions_filter_view" => 'Distinct',

            "properties_interactions_add_interaction" => "https://mysite/add-interaction/?entry=" . $entry_id . ",Add interaction"

            );

        $entry_id = \pdblog\log\entry_db::update_entry( $log_name, $entry_id, $data_user);
Add interaction will become Addinteraction so I have to change $this->field->value in the template to display the displayed link correctly.
Use %20 for the space. This is standard for URL vartiables, spaces are not allowed in URLS.
Yes I had tried that but it didn’t work.
I am talking about the displayed text, not the URL part.
Add%20interaction still converts to Addinteraction but nevermind it’s fine with the filter thanks!
It gets a bit trickier now as I need to copy a link field to another link field using the pdb-after_submit_update filter but the displayed text of the link gets trimmed and now I don’t see a way to find out where are the spaces to reconstruct the text to display. I hope it makes sense.
There was definitely a better way to achieve this but at least I managed to do it like this for those running into the same issue :
add_filter( 'pdb-before_submit_update', 'ulm_modify_before_update' );

function ulm_modify_before_update( $post )

{

if (sizeof($post['agent_link'])==2) $post['agent_link'][1] = str_replace(" ","-",$post['agent_link'][1]);

return $post;

}

add_filter( 'pdb-after_submit_update', 'ulm_add_interaction_on_update' );

function ulm_add_interaction_on_update( $post )

{

$tablink = explode('"',$post['agent_link']);

if (sizeof($tablink)===5) $result['properties_interactions_agent_link'] = $tablink[1] . ',' .  ucfirst($tablink[3]);

}
And in the template I modify change the dashes to spaces :
if ($this->field->name === 'properties_interactions_agent_link') {

$this->field->value = str_replace("-"," ",$this->field->value);

 }
Hi!
I have 2 small issues:
1. pdb_log_list displays the number of entries in the page (list_limit) instead of the total number of entries found like pdb_record does. Tested with a static shortcode in a page so I guess that’s the way it’s supposed to work?
2. If I echo pdb_log_list in the content of a template the pagination works fine but if I echo the shortcode inside a field group tab then the pagination breaks and I get the error below. Already tried the in_content snippet. I know it’s a very special case but if you know how to fix that I’d appreciate a lot thank you. If not I’ll have to set a very high limit for the list.
The JS error :
list-filter.js?ver=1.7.4:136 Uncaught TypeError: Cannot read property ‘match’ of undefined
at add_value_to_submission (list-filter.js?ver=1.7.4:136)
3. As an evolution it’d be nice to be able to filter also on the record_id which is already in the log table but apparently not available in the filter so in the meantime I have to populate another variable with the record_id whenever I create a log entry.
The log list cound display is supposed to show the global count, I’ll need to issue a fix for that.
I don’t know how to answer your second question, but the log field uses a combination of inline and external javascript that may not play well with a custom setup like you’re attempting.
Thanks for considering the fix:
I’m trying to display the pdb_log_list inside a group tab like this, maybe i’m doing it wrong :
<div class="input-group" >

             <?php

              if ($this->group->name === 'comments') {

                  echo do_shortcode('[pdb_log_list.....]');

               } else {

              $this->field->print_element_with_id();

              }

              ?>

            </div>
I created a workaround in list-filter.js :
var add_value_to_submission = function (el, submission) {

    var value = encodeURI(el.val());

    var fieldname = el.attr('name');

    if(typeof fieldname != 'undefined') {  //Added code

    var multiple = fieldname.match(/\[\]$/);
No idea what field is undefined in that scenario but at least the pagination works fine with that added condition
Filtering works in that case but it refreshes the page so it takes me back to the first tab. I guess I’ll have to display the pdb_log_list via another way
Comparing the html code between a normal call and that special call of the shortcode I can see that the form is not included so I am missing this line in the special call :
<form method="post" class="sort_filter_form" action="https://mysite/test-pdblog/#participants-list-1" data-ref="update">
The form code is in the source code tho but not in the elements tab of the dev tools
I managed to make the form appear in the DOM tree by adding an empty form in the pdb-log_list template :
<form>

</form>

      <?php $this->search_sort_form_top( false, 'form-horizontal' ); ?>
No idea why I needed to do that but at least now it works in both cases :)
I’m glad you got it working…I can’t be of too much help here, no way for me to corroborate what you’re seeing. You’ve managed to help me find a couple of bugs, and I appreciate that. Let me know if you come across more bugs.
Hello Roland!
After updating the plugin everything is working as it should, thanks again for the fix.
I have a question: is it possible to add one of the log fields to the signup page?
Update:
I’m sorry to report that the problem reoccurred. It was all good for a while, but then the csv upload dialog box appeared again.
I made no significant changes to the site, i just added a few PDb log fields.
I tested the updated version of the plugin on a site with Elementor plugin and it worked. Now it doesn’t work anymore.
Can you send me a link so I can see it?
Thank you for your reply.
Finally, it works :)
The WP GeneratePress theme has an option for minifying (sort of). I disabled it – problem solved.
Thanks again.
Best regards,
Elvis
No, log fields can’t be imcluded in signup forms, they require that the record exist first.
Update 2:
this is the console log error on the frontend:
Uncaught ReferenceError: List is not defined
at ?pid=3G217:5477
at ?pid=3G217:5496
this is the console log on the backend (admin):
[DOM] Found 16 elements with non-unique id #_wpnonce: …
[DOM] Found 5 elements with non-unique id #export_log: …
[DOM] Found 5 elements with non-unique id #pdb-form_element-1:
and some more simmilar errors
OK, is that while using the default template? The first error means the core JS that the list uses was not loaded.
Hi Roland!
I tested my setup on a few environments, but the problem is still there.
I have one test version of my site hosted on my syno NAS (through ddns). On that version I have problems I posted before. PDb Log problem is there while using both, the custom template and the default ones (PDb Custom Templates 2 plugin enabled and disabled).
I migrated my site on a local environment (Local by FlyWheel) and the problem still extists, but only while using custom templates. Default pdb_record template show no errrors, and all is well, but I need my customizations to work with the PDb Log plugin (tabs etc, edit links etc…).
By the way, I read the plugin and addons documentation frequently, just in case I missed something, and I noticed that the problem with JS on your site is still there (https://xnau.com/work/wordpress-plugins/participants-database/list-participants/participant-log-demo-record/participant-log-interactive-demo/)
try updating the Participant Log plugin.
The update resolved the issue.
Thank you very much!
Best regards,
Elvis.
Update:
I added some more pdb log fields and the problem remains…
I disabled all plugins except Participants database plugin and PDb Log.
I’m using Generatepress theme and Google Chrome.
Does it work using a default template instead of your usertype template?
PDB Log still not working.
The setup:
I customized a few templates so I could simulate multi database.
I have 4 user types.
Every user type signs up through their respective wp page with pdb_signup shortcode,
based on form_type field (post->post_name) input.
Something like this: usertype 1 signup page – shortcode: pdb_signup template=usertype_1 tabs=true groups=… an so on.
Users are displayed on wp page with pdb_list shorcode with edit links and last_name single links.
The user cliks on Edit User link which opens up wp page with pdb_record template=usertype code.
The usertype temlplate is customized following your tutorial (https://xnau.com/multiple-databases-with-participants-database/).
That usertype template creates the appropriate shortcode with different field groups for each usertype.
This shortcode opens up the wp page with pdb_record template (customized it a bit – just added jQuery function for optgroups).
I am not using any plugins other than pdb-related (I purchased some add-ons and customized a few gists).
So, no caching or minifying plugins.
I tried turning off all addons one by one and found out that the usertype template is somehow the culprit.
I can’t figure out why or how. Turning off pdb custom templates also resolves the problem.
Thank you.
P.S.
I tried posting comments (as logged in user on your site), but the site tells me that my post is spam.
Hello Roland!
I purchased Participant Log add-on recently and I’m having some issues. While adding new log the pop-up window stays open and the litle circle animation keeps looping. After I cancel the process and refresh the page the log shows up.
I (miss)posted this on WordPress.org under the PDB plugin support forum.
However, I’m still having problems.
While chekcing the Participant Log Interactive Demo out on your site, the sam problem came up. The CSV upload dialog opened and I can’t close it. The same happens on my site (live and local). Even from two different computers.
I’m using Firefox, Chrome (latest versions, tried turning off extensions and add-blockers) and Local by FlyWheel.
The console log is full of errors and warnings.
Please help.
Thank you.
The problem in the site (thanks for letting me know about that) was due to an accelerator plugin I am using that causes the JS scripts to be loaded asynchronously. When I exempted the participant_log.js script from that, it fixes the problem.
If you’re using any accelerator plugins that affect how javascript is served (async, minifying, etc), I suggest you turn that off until you get everything working.